Planning a large light show in 2026 requires more than adding the wattage printed on each fixture. LED walls, moving heads, lasers, control consoles, media servers, and audio equipment can share one production site. Their electrical demand changes during rehearsals, cues, and peak scenes. A quiet fade may draw far less power than a full-white LED wall with every moving light active.
This guide explains How to calculate the power consumption of a large light show using practical production data. You will learn how to build an equipment inventory, convert watts into kilowatts, estimate operating hours, and calculate energy use in kilowatt-hours. The process also considers power factor, startup demand, dimming behavior, cable losses, and temporary distribution equipment. Small details matter. A 1,000-watt fixture does not always consume 1,000 watts continuously.
Field measurements improve confidence. A qualified technician can use a calibrated power meter at the distribution panel and compare readings with the design estimate. Record normal scenes, transitions, and the highest-demand cue. Do not rely only on manufacturer labels.
Real shows are rarely perfect.
I have seen spreadsheets underestimate demand because operators forgot video processors and charging stations. I have also seen estimates become unnecessarily large by assuming every fixture runs at full output. Both mistakes affect generator sizing, operating costs, and venue coordination. The calculations should therefore remain transparent, conservative, and easy to review. Always confirm local electrical requirements and have installations checked by competent professionals. Safety must guide every number.
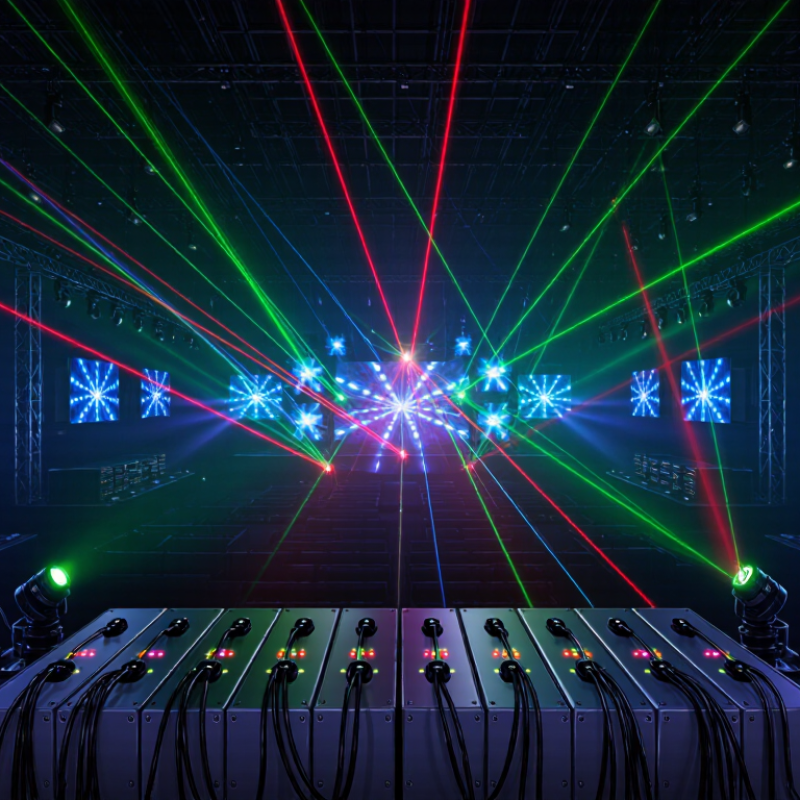
A large light show is more than a collection of fixtures. It is a coordinated electrical system with lights, control consoles, signal processors, cables, distribution panels, and safety devices. Define every load before calculating consumption. Record each fixture’s rated watts, quantity, operating hours, and expected brightness level. Do not guess.
In field planning, I separate continuous loads from temporary peaks. Moving lights, video surfaces, and effects may draw more power during startup or intense scenes. Add control equipment and cooling systems, even when their loads seem small. Then apply a reasonable reserve, often 20 to 30 percent, because real conditions change. Dust, heat, cable length, and voltage drop can affect performance. That matters.
The power source should match the venue and the show’s operating profile. Utility power may provide stable capacity, while portable generators offer flexibility for outdoor installations. Battery systems can support quiet zones, backup control, or short performances, but their usable capacity falls in cold weather. Hybrid setups are useful when peak demand is brief. Measure actual current with certified instruments during a rehearsal, not only from equipment labels. Labels describe limits, not always real consumption.
I have seen plans fail because one distribution cabinet was treated as the whole system. It was not. Each circuit needs a clear load schedule, phase balance, protection rating, and cable route. Leave room for correction. A perfect spreadsheet can still meet an imperfect site.
How to Calculate Large Light Show Power Consumption in 2026?
List the rated wattage of every lighting component before estimating total demand. Include moving fixtures, LED bars, pixel panels, strobes, practical lamps, control consoles, media servers, and power supplies. Record each unit’s quantity, voltage, current, and nameplate wattage. A simple spreadsheet prevents hidden loads.
Use this formula: quantity × rated watts = circuit load. For example, 48 LED fixtures rated at 320 watts require 15,360 watts at full output. Add control equipment and distribution losses separately. Power supplies often draw more than their connected lamps. Check their input ratings, not only their output ratings. The U.S. Department of Energy’s 2023 Solid-State Lighting R&D Opportunities report identifies 200 lumens per watt as an important development benchmark, but fixture efficiency does not equal electrical demand.
Allow realistic headroom. A 20,000-watt lighting package should not automatically receive a 20,000-watt supply. Account for inrush current, power factor, cable losses, and continuous operating limits. The International Energy Agency has reported that lighting represents approximately 15% of global electricity use, making accurate measurement valuable beyond one event. My field calculations still miss details when rental labels are incomplete. Confirm every plate physically. Then compare the maximum total with measured console data during rehearsals. The result may differ. That difference deserves investigation.
For a large light show in 2026, I begin with an equipment schedule, not a guess. List every fixture, controller, dimmer, video processor, and distribution board. Record quantity, rated watts, voltage, and power factor when available. Connected load is simple: multiply each item’s quantity by its rated wattage, then add the results. For example, 240 fixtures at 180 watts equal 43.2 kW. Add control, audio, and video equipment separately. Small devices accumulate quickly.
Real-time power demand is different. It shows what the system may draw during each show scene. Mark the brightest cue, motor movement, video playback, and equipment startup. Then calculate simultaneous demand instead of using every device at full power. A practical estimate might apply a measured operating factor, but do not trust assumptions blindly. LED fixtures may use less than their nameplate rating, while power supplies can create short startup surges. I use a calibrated power meter during rehearsals and record peak, average, and idle readings. Short peaks matter.
Current can be estimated with watts divided by voltage and power factor. Three-phase systems require a qualified electrician to verify phase balance, protection, cable capacity, and local requirements. Keep spare capacity for temperature changes, added fixtures, and measurement error. My first estimate is often too neat. Reality is noisier. Recheck every circuit after the final programming session, especially when several bright scenes overlap.
| Load Category | Quantity | Rated Power per Unit (W) | Connected Load (kW) | Demand Factor | Estimated Real-Time Demand (kW) | 8-Hour Energy (kWh) |
|---|---|---|---|---|---|---|
| LED Video Display Panels | 120 | 350 | 42.00 | 85% | 35.70 | 285.60 |
| Moving-Head Fixtures | 48 | 420 | 20.16 | 75% | 15.12 | 120.96 |
| LED Wash Fixtures | 72 | 220 | 15.84 | 70% | 11.09 | 88.70 |
| LED Strobe Fixtures | 24 | 300 | 7.20 | 60% | 4.32 | 34.56 |
| Laser Light Systems | 12 | 500 | 6.00 | 80% | 4.80 | 38.40 |
| Pixel Bar Fixtures | 60 | 150 | 9.00 | 65% | 5.85 | 46.80 |
| Lighting Control, Networking and DMX Equipment | 1 | 2,500 | 2.50 | 100% | 2.50 | 20.00 |
| Lighting System Total | 102.70 kW | — | 79.38 kW | 635.02 kWh | ||
| Calculation Item | Value | Calculation Basis |
|---|---|---|
| Total Connected Load | 102.70 kW | Quantity × Rated Power per Unit |
| Diversified Lighting Demand | 79.38 kW | Connected Load × Demand Factor |
| Estimated Distribution Losses | 3.97 kW | 5% of Diversified Lighting Demand |
| Estimated Real-Time Site Demand | 83.35 kW | Diversified Demand + Distribution Losses |
| Estimated Apparent Power at 0.90 Power Factor | 92.61 kVA | 83.35 kW ÷ 0.90 |
| Estimated Current at 400 V, Three-Phase | 134 A | kVA × 1,000 ÷ (√3 × Voltage) |
| Recommended Temporary Service Capacity | 200 A, 400 V, Three-Phase | Includes operating margin for startup, thermal effects and future expansion |
| Estimated Energy Consumption for an 8-Hour Show | 668.80 kWh | 83.35 kW × 8 hours |
Estimate energy from equipment ratings, show duration, and daily use. Begin with an equipment list. Record each fixture’s wattage, quantity, control console load, video processors, and cooling equipment.
For example, 200 lighting fixtures rated at 300 watts require 60 kilowatts. A five-hour show running for 30 days consumes 9,000 kWh.
Add three daily hours for setup, testing, and standby. The revised estimate becomes 14,400 kWh.
U.S. Department of Energy’s 2023 Solid-State Lighting R&D Opportunities report discusses commercial LED systems exceeding 100 lumens per watt. However, brighter output does not always mean lower consumption. Beam movement, color mixing, and frequent dimming change real demand. The International Energy Agency’s Energy Efficiency 2023 report also highlights controls and operating practices as important efficiency factors.
Tips: Measure actual input power with a three-phase meter. Do not rely only on nameplate ratings. Add 10–25% for control, distribution, and cooling losses. This allowance is imperfect. Temporary systems behave differently in hot weather. Recheck the estimate after one full rehearsal. A surprising load often hides in “idle” equipment. Record peak demand separately, because average energy use cannot size electrical distribution safely.
Estimate every fixture’s rated wattage, then multiply it by the planned quantity. Add control consoles, processors, cooling fans, and distribution equipment. For example, 300 fixtures rated at 150 watts require 45,000 watts, or 45 kilowatts. This is only the connected load. Power supplies can create short startup surges, especially when many units activate together. Review their technical sheets instead of trusting average consumption figures.
For safe capacity, calculate the peak load rather than the show’s typical load. Add at least 20% spare capacity for cable losses, temperature changes, and future fixtures. A 45-kilowatt system may therefore need about 54 kilowatts before site-specific adjustments. Large installations should also consider three-phase balance, breaker ratings, voltage drop, and separate emergency circuits. A qualified electrical professional must verify the design against local regulations. My early estimates often ignored temporary equipment. That mistake was expensive to correct.
List moving fixtures, LED bars, pixel panels, strobes, practical lamps, and control equipment. Include media servers, cooling fans, processors, and power supplies. Record quantity, voltage, current, and rated wattage. Keep it visible.
Multiply the quantity by each component’s rated wattage. Forty-eight fixtures rated at 320 watts require 15,360 watts. Add control equipment and distribution losses separately. Do not rely on typical usage alone.
A power supply may draw more electricity than its connected lamps require. Startup can also create a short surge. Check the input rating on every unit. Output ratings are incomplete.
Add at least 20% spare capacity after calculating the peak connected load. A 45-kilowatt system may need approximately 54 kilowatts. Site conditions may require more. Oversizing blindly also creates unnecessary costs.
Typical load reflects normal operation during a show. Peak load includes full output, simultaneous activation, and startup surges. Design for peak demand, not comfortable averages. A quiet rehearsal can mislead you.
Review three-phase balance, breaker ratings, voltage drop, cable losses, and continuous operating limits. Consider temperature changes and emergency circuits. A qualified electrical professional should verify the design locally.
Measure a sample circuit during rehearsals under realistic operating conditions. Compare the readings with console data and the calculated maximum. The result may differ. Investigate that difference carefully.
Keep fixture counts, wattage, circuit assignments, and startup behavior in one spreadsheet. Recalculate after every equipment change. Temporary equipment is easy to forget. Small edits accumulate quickly.
How to calculate the power consumption of a large light show begins with identifying the complete system and its power sources, including lighting fixtures, control equipment, distribution units, and backup supplies. Create a detailed inventory of every component and record its rated wattage. Then add these values to determine the total connected load. Because fixtures may not operate at full output continuously, estimate real-time demand by considering brightness levels, operating patterns, control settings, and simultaneous use.
Next, calculate energy consumption by multiplying the expected operating power by the show duration and the number of operating days. This provides a practical estimate of daily and total energy use. Finally, select a safe power capacity that can support peak demand while allowing room for startup surges, uneven loading, equipment tolerance, and future expansion. A carefully planned calculation improves reliability, supports safer electrical distribution, and helps control operating costs throughout the entire light show.

WoodLit Light